Academic Programs

Admissions

Tuition & Financial Aid

Student Experience

About CUUniversity Outcomes

Explore Cornerstone

University Outcomes

At Cornerstone University and Cornerstone Theological Seminary, we’re committed to helping students succeed, whatever that may look like for them. We take seriously our role to equip students with the knowledge, skills and dispositions they’ll need to thrive both in their present and future vocation.

Student and
Academic Learning Outcomes

In our desire to express the value of a Cornerstone education, CU is committed to publishing data regarding retention rates, graduation rates, placement rates, licensure rates and other relevant information related to student and academic learning outcomes of the university at both the undergraduate and graduate levels.

While reviewing this information, please keep the following in mind:

  • All graduation rates are based on up to six years of attendance for bachelor’s programs, which equates to 150% of the normal completion time.
  • We have elected not to report transfer-out rates because our College’s mission does not include providing substantial preparation for students to enroll in another eligible institution without completing or graduating.
  • These charts do not identify the reasons why our students withdrew; therefore, students who withdrew for personal or medical reasons are included.
  • Graduation rates do not include students who left school to serve in the U.S. Armed Forces, on official church missions, or with a foreign aid service of the federal government, or students who died or were totally and permanently disabled.
Jump To:

Traditional Undergraduate Outcomes

Retention and Graduation Rates

Cohort Year Freshman Retention Rate* Four-Year Graduation Rate Six-Year Graduation Rate
2011 76% 36.6% 52.1%
2012 74.24% 43.9% 55.8%
2013 75.65% 49.6% 60.29%
2014 76.49% 53% 64.9%
2015 75.16% 51.86% 58.70%
2016 73.5% 49.82% 58.85%
2017 79.57% 54.84%
2018 78.52% 55.87%
2019 83.85%
2020 78.70%
2021 79%

*One-year retention rates reflect first-time, full-time, degree-seeking freshmen who returned their second year. Six-year graduation rates reflect full-time, degree-seeking students who graduated within six years.

Persistence Rates

Year Fall to Spring Rate** Spring to Fall Rate**
2015-16 90% 78%
2016-17 91% 81%
2017-18 92% 80%
2018-19 92% 87%
2019-20 93% 84%
2020-21 93% 90%
2021-22 91% 87%

**These rates are based on the total number of individuals who returned the following semester divided by the total number of possible returning students (i.e., excludes those who graduated).

Employment and Graduate School Placement Rates

Graduation Year Rate*** Knowledge Rate****
2016 94% 93%
2017 94% 99%
2018 94% 97%
2019 96% 98%
2020 95% 90%
2021 94% 89%

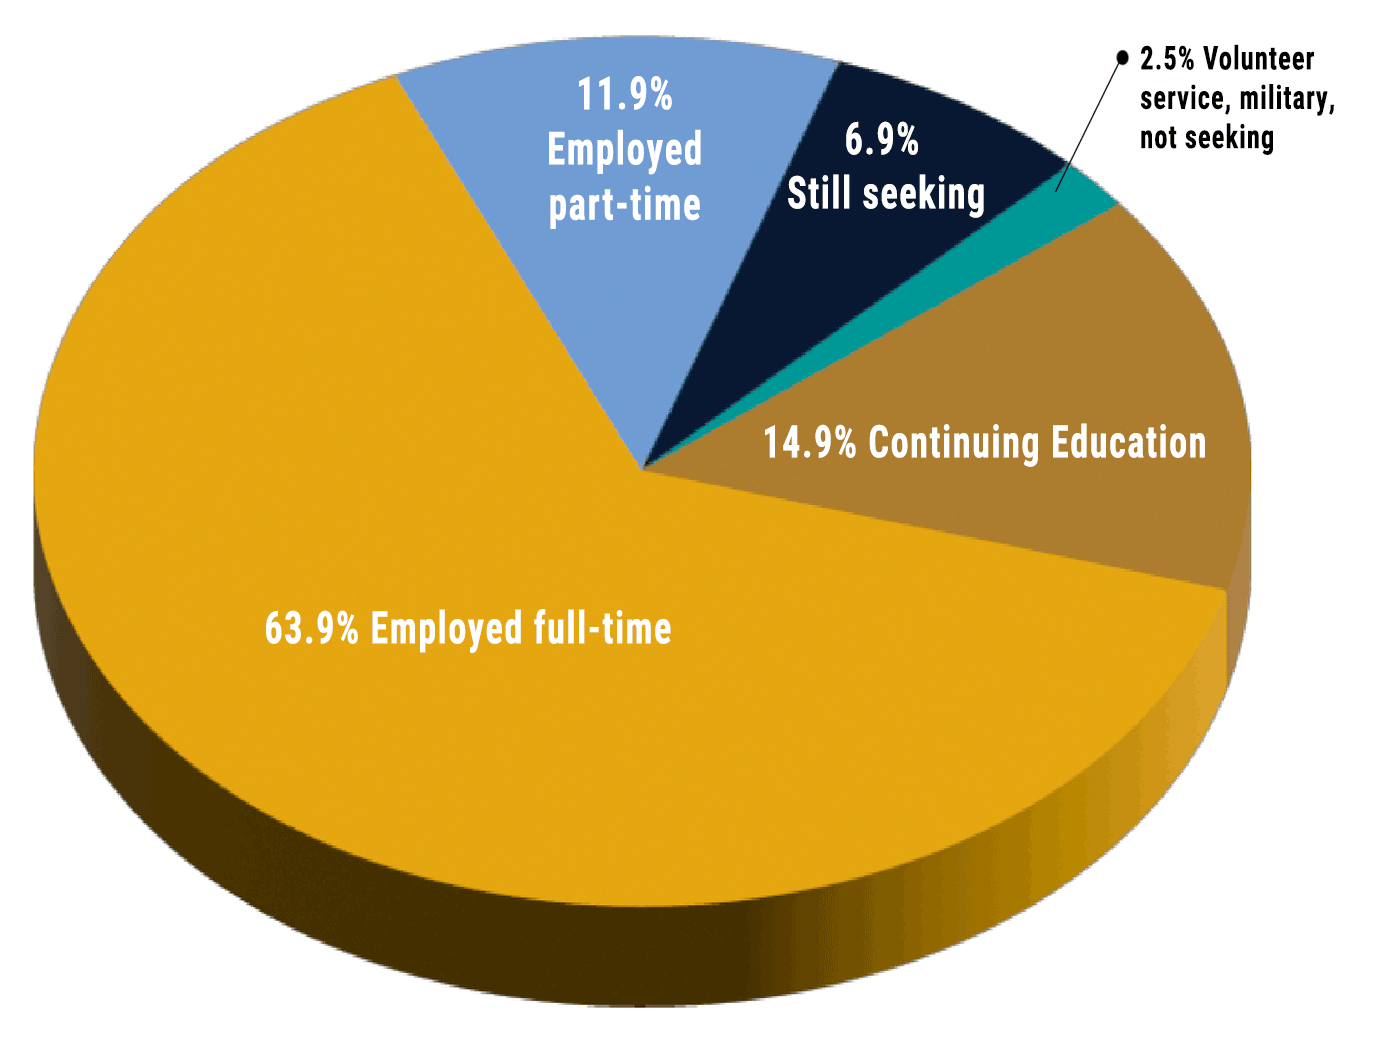
***This number reflects the percentage of traditional undergraduate graduates who were employed or enrolled in graduate school within six months of graduation.

****The knowledge rate reflects the percentage of graduates for which Cornerstone was able to gather employment or graduate school information.

Licensure/Certification Exam Pass Rates

Academic Learning Outcomes

Cornerstone University equips students to excel as flourishing influencers in the world for Christ and His kingdom. Here, we define vocational preparation as the faithful stewardship of one’s God-given talents and opportunities throughout his or her professional, personal and civic life. As a result, our Christ-centered, student-focused learning community supports the development of intellectual curiosity, character-based virtues and creative habits.

Comprised of multiple principal academic units, Cornerstone awards associate (A.A., A.S.); bachelor’s (B.A., B.Mus., B.S., B.S.W.); master’s (M.A., M.B.A., M.Div., M.S.); and doctoral (Ed.D.) degrees.

Educational Outcomes

Our graduates enter career fields, ministry roles and graduate programs with essential knowledge and skills in five distinct areas or learning domains, all of which help produce well-rounded individuals who are prepared to influence the world for Christ. Our five university-wide learning outcomes include specialized knowledge; applied knowledge and collaborative learning; intellectual skills; civic and global learning and biblical worldview integration.

  1. Specialized Knowledge: Cornerstone students will demonstrate knowledge of and proficiency in the terminology, theories, concepts, practices and skills specific to their field of study.
  2. Applied Knowledge and Collaborative Learning: Cornerstone students will exhibit competency in applying their knowledge to address real-life problems through both individual and group effort.
  3. Intellectual Skills: Cornerstone students will demonstrate their ability to integrate both traditional and non-traditional cognitive skills, including analytical inquiry, information literacy, quantitative fluency and communicative fluency.
  4. Civic and Global Engagement: Cornerstone students will demonstrate intercultural competence in addressing civic, social, environmental and economic issues.
  5. Biblical Worldview Integration: Cornerstone students will be able to articulate a Christ-centered worldview and its personal, professional and communal embodiment through Christian virtues.

Program-Specific Learning Outcomes

Undergraduate Program Learning Outcomes

Professional & Graduate Studies Outcomes

Retention Rates

Cornerstone University’s Professional & Graduate Studies division tracks attendance and students’ successful completion of the first and second classes in each cohort. To calculate data, the Professional & Graduate Studies division looks at whether or not students have persisted in a given cohort. A student is considered retained when they receive a grade for a course or take a leave of absence.

Degree Level Academic Year 1st Course Retention Rate Average 2nd Course Retention Rate Average
Associate 2018-19 98.27% 93.61%
Associate 2019-20 96.9% 93.34%
Associate 2020-21 96.43% 90.56%
Bachelor’s 2018-19 98.18% 93.05%
Bachelor’s 2019-20 96.98% 93.72%
Bachelor’s 2020-21 97.29% 91.59%
Master’s 2018-19 98.17% 93.28%
Master’s 2019-20 97.06% 93.56%
Master’s 2020-21 97.15% 90.61%

Graduation Rates

Cornerstone University’s Professional & Graduate Studies division calculates four-year and six-year graduation rates at end of each academic year for bachelor’s, master’s and doctoral degrees and the six-year graduation rate for associate degrees.

To calculate graduation rates, the Professional & Graduate Studies division looks at all students whose initial start date at a given degree level (i.e., associate, bachelor’s, master’s, doctorate) falls within the date parameters in question. The university then looks at students’ current academic status (i.e., active, withdrawn, graduate). The ratio of graduates to the total number of students gives Cornerstone its graduation rate for the academic year in question.

Degree Level Academic Year Six-Year Graduation Rate
Associate 2008/2009 36%
Associate 2009/2010 47%
Associate 2010/2011 43%
Associate 2011/2012 39%
Associate 2012/2013 33%
Associate 2013/2014 37%
Associate 2014/2015 38%
Associate 2015/2016 41%
Bachelor’s 2008/2009 66%
Bachelor’s 2009/2010 70%
Bachelor’s 2010/2011 68%
Bachelor’s 2011/2012 75%
Bachelor’s 2012/2013 66%
Bachelor’s 2013/2014 73%
Bachelor’s 2014/2015 66%
Bachelor’s 2015/2016 68%
Master’s 2008/2009 75%
Master’s 2009/2010 76%
Master’s 2010/2011 74%
Master’s 2011/2012 76%
Master’s 2012/2013 80%
Master’s 2013/2014 81%
Master’s 2014/2015 73%
Master’s 2015/2016 80%
Doctorate 2015/2016 46.2% (four-year grad rate)

Student Outcomes

Professional & Graduates Studies (PGS) works with Cornerstone University’s Alumni Office to survey all students who graduated during a given academic year (i.e., December, May and August grads). The following rates demonstrate the percentage of students who were employed or in grad school within six months of completing their degree programs.

PGS Graduate Survey Employment Rates

Survey/Sample Size Associate Bachelor’s Master’s Doctoral Overall Average
2015-16 Graduate Survey
92 total respondents
83% 93% 95% N/A 90.33%
2016-17 Graduate Survey
57 total respondents
98% 93% 92% N/A 94.33%
2017-18 Graduate Survey
61 total respondents
94% 95% 93% N/A 94%
2018-19 Graduate Survey
51 total respondents
90% 94% 93% N/A 92.33%
2019-20 Graduate Survey
63 total respondents
89% 95% 93% N/A 92.33%
2020-21 Graduate Survey
45 total respondents
50% 95% 100% N/A 81.67%
2021-22 Graduate Survey
49 total respondents
75% 95% 95% 100% 93.87%

Academic Learning Outcomes

Cornerstone University equips students to excel as flourishing influencers in the world for Christ and His kingdom. Here, we define vocational preparation as the faithful stewardship of one’s God-given talents and opportunities throughout his or her professional, personal and civic life. As a result, our Christ-centered, student-focused learning community supports the development of intellectual curiosity, character-based virtues and creative habits.

Comprised of multiple principal academic units, Cornerstone awards associate (A.A., A.S.); bachelor’s (B.A., B.Mus., B.S., B.S.W.); master’s (M.A., M.B.A., M.Div., M.S.); and doctoral (Ed.D.) degrees.

Educational Outcomes

Our graduates enter career fields, ministry roles and graduate programs with essential knowledge and skills in five distinct areas or learning domains, all of which help produce well-rounded individuals who are prepared to influence the world for Christ. Our five university-wide learning outcomes include specialized knowledge; applied knowledge and collaborative learning; intellectual skills; civic and global learning and biblical worldview integration.

  1. Specialized Knowledge: Cornerstone students will demonstrate knowledge of and proficiency in the terminology, theories, concepts, practices and skills specific to their field of study.
  2. Applied Knowledge and Collaborative Learning: Cornerstone students will exhibit competency in applying their knowledge to address real-life problems through both individual and group effort.
  3. Intellectual Skills: Cornerstone students will demonstrate their ability to integrate both traditional and non-traditional cognitive skills, including analytical inquiry, information literacy, quantitative fluency and communicative fluency.
  4. Civic and Global Engagement: Cornerstone students will demonstrate intercultural competence in addressing civic, social, environmental and economic issues.
  5. Biblical Worldview Integration: Cornerstone students will be able to articulate a Christ-centered worldview and its personal, professional and communal embodiment through Christian virtues.

Program-Specific Learning Outcomes

Adult Program Learning Outcomes

Graduate Program Learning Outcomes

Cornerstone Theological Seminary Outcomes

Educational Effectiveness and Student Outcomes

Assessment of student learning is highly valued at Cornerstone Theological Seminary. It is our responsibility to deliver on the promise to provide excellence in graduate theological education. At CTS, assessment of student outcomes is not an externally imposed burden. Rather, assessment of student learning and the disclosure of educational effectiveness is a task of stewardship, a process for organizational learning, and a matter of accountability.

The effectiveness of our educational programs is assessed in a disciplined and routine manner. Through a variety of instruments and processes, we assess the achievement of the intended student learning outcomes of our curriculum, student and alumni satisfaction, readiness for ministry of our students, and vocational achievement of our graduates.

The following provides a few highlights and demonstrates how CTS is delivering on its promise to provide excellence in graduate theological education.

Vocational Readiness for Ministry

Academic Year Midpoint Assessment Exit Assessment
2015-16 94% 97%
2016-17 83% 100%
2017-18 90% 100%
2018-19 78% 92%
2019-20 79% 96%
2020-21 77% 100%
2021-22 100% 94%

*Percentage of students completing the assessment process that received an outcome of fully affirm in vocational readiness

Vocational Outcomes

Academic Year Master of Divinity
Placement Rate
Master of Divinity
Knowledge Rate
Master of Arts
Placement Rate
Master of Arts Knowledge Rate
2017-18 100% 94% 97% 94%
2018-19 83% 92% 83% 95%
2019-20 93% 100% 88% 93%
2020-21 100% 100% 97% 94%
2021-22 100% 100% 85% 90%

*Percentage of students reporting vocational placement or enrollment in continuing education 6-12 months post-graduation.

Retention and Graduation Rates

Cohort Year First-Year (FA to FA)
Retention Rate
Master of Arts
Graduation Rate (3 Years)
Master of Divinity
Graduation Rate (5 Years)
2012-13 76% 71% (15-16 Grads) 42% (17-18 Grads)
2013-14 73% 49% (16-17 Grads) 58% (18-19 Grads)
2014-15 71% 52% (17-18 Grads) 57% (19-20 Grads)
2015-16 73% 49% (18-19 Grads) 52% (20-21 Grads)
2016-17 82% 60% (19-20 Grads) 82% (21-22 Grads)
2017-18 89% TBD (20-21 Grads) TBD (22-23 Grads)
2018-19 80% TBD (21-22 Grads) TBD (23-24 Grads)
2019-20 78% TBD (22-23 Grads) TBD (24-25 Grads)
2020-21 77% TBD (23-24 Grads) TBD (25-26 Grads)
2021-22 41% TBD (24-25 Grads) TBD (26-27 Grads)

*First-year retention rates reflect percentage of students from the respective cohort returning their second year (FA to FA). Graduation rates reflect the percentage of those in a respective cohort who completed their degree (M.A. or M.Div.) in three or five years respectively.

Licensure Exam Pass Rates

NCE Pass Rates—Clinical Mental Health Counseling

The pass rate for the National Counselor Examination (NCE) as given by the State of Michigan for graduates of Cornerstone University (GRTS) is 100%.

The State of Michigan provides NCE pass rates for any counselor who has a Michigan license (limited or full). The State of Michigan does not track NCE pass rates for those who have never applied for a license.

The National Counselor Examination (NCE) is offered through the National Board of Certified Counselors (NBCC). The NBCC does not track pass rates for those that take the NCE; they only track those who take the exam as part of the National Certified Counselor (NCC) process.

Academic Learning Outcomes

Cornerstone University equips students to excel as flourishing influencers in the world for Christ and His kingdom. Here, we define vocational preparation as the faithful stewardship of one’s God-given talents and opportunities throughout his or her professional, personal and civic life. As a result, our Christ-centered, student-focused learning community supports the development of intellectual curiosity, character-based virtues and creative habits.

Comprised of multiple principal academic units, Cornerstone awards associate (A.A., A.S.); bachelor’s (B.A., B.Mus., B.S., B.S.W.); master’s (M.A., M.B.A., M.Div., M.S.); and doctoral (Ed.D.) degrees.

Educational Outcomes

Our graduates enter career fields, ministry roles and graduate programs with essential knowledge and skills in five distinct areas or learning domains, all of which help produce well-rounded individuals who are prepared to influence the world for Christ. Our five university-wide learning outcomes include specialized knowledge; applied knowledge and collaborative learning; intellectual skills; civic and global learning and biblical worldview integration.

  1. Specialized Knowledge: Cornerstone students will demonstrate knowledge of and proficiency in the terminology, theories, concepts, practices and skills specific to their field of study.
  2. Applied Knowledge and Collaborative Learning: Cornerstone students will exhibit competency in applying their knowledge to address real-life problems through both individual and group effort.
  3. Intellectual Skills: Cornerstone students will demonstrate their ability to integrate both traditional and non-traditional cognitive skills, including analytical inquiry, information literacy, quantitative fluency and communicative fluency.
  4. Civic and Global Engagement: Cornerstone students will demonstrate intercultural competence in addressing civic, social, environmental and economic issues.
  5. Biblical Worldview Integration: Cornerstone students will be able to articulate a Christ-centered worldview and its personal, professional and communal embodiment through Christian virtues.

Program-Specific Learning Outcomes

Seminary Program Learning Outcomes

Asia Biblical Theological Seminary Outcomes

Retention and Graduation Rates

Year Accepted 1st Year Student Retention Rate* 5-Year Graduation Rate** Degree Program Graduation Rate***
2015 65% 42% 58%****
2016 78% 58% 62%*****
2017 89% 32% 50%******
2018 78%
2019 78%
2020 72%
2021 81%

* Percentage of students who enrolled in a course during the year following their year of acceptance into a degree program
**Percentage of students who graduated within 5 years of acceptance into a degree program
***Cumulative percentage of students who graduated regardless of timeline
****An additional 21% are still active students
*****An additional 17% are still active students
******An additional 25% are still active students

University Resources

Annual Assessment Reports

For Cornerstone, assessment is a matter of institutional integrity. In addition to providing an opportunity for organizational learning and a credible foundation for data-based decision making, we view assessment as an ongoing and cyclical process.

Purpose of Assessment

Because we understand assessment as having internal value and theological connections, Cornerstone engages in the work of assessment to achieve the following objectives:

  • To document an explicit plan and process for assessing student learning.
  • To clearly articulate a set of student learning outcomes for degree programs and individual courses.
  • To map intended student learning outcomes (SLOs) across the curriculum (e.g., mapping SLOs to select courses and student learning artifacts).
  • To enact assessment projects on a scheduled and routine basis which seek to measure the level of achievement of the intended student learning outcomes at the course and program level.
  • To identify needed changes to the curriculum (programs and courses) through the work of assessment.
  • To demonstrate the administrative will to enact the needed changes identified in the work of assessment.
  • To document the changes to curriculum resulting from the administration of the assessment plan and process.
  • To develop as educational professionals in the art and science of assessment of student learning.
  • To facilitate a culture of assessment that leads to continuous improvement of curriculum, personnel, programs and overall educational quality.

Assessment Reports

Our annual assessment reports reflect the work of the university in the area of assessment. The reports highlight some of the best practices observed in specific divisions or courses. In addition, the reports outline next steps we are taking to invest in the advancement of assessment at Cornerstone.

Annual Assessment Report for 2021-22

Annual Assessment Report for 2020-21

Annual Assessment Report for 2019-20

Annual Assessment Report for 2018-19

Annual Assessment Report for 2017-18

Annual Assessment Report for 2016-17

Annual Assessment Report for 2015-16

Annual Assessment Report for 2012-13

Annual Assessment Report for 2010-11

Annual Assessment Report for 2009-10

Annual Assessment Report for 2008-09

Annual Assessment Report for 2007-08

Annual Assessment Report for 2006-07

Annual Assessment Report for 2005-06

Student-Athlete Outcomes

Table 1: All Students Fall 2015 Cohort

Category Graduation/Completion Rate
Gender
Men 62%
Women 59%
Race or Ethnicity
Non-Resident Alien 80%
Black or AA 35%
American Indian/Alaskan Native
Asian
Nat Hawaiian or Other Pacific Islander
Hispanic or Latino 55%
White Non-Hispanic 61%
Two or more races 50%
Race/Ethnicity Unknown n/a
Financial Aid
Pell Grant Recipient 60%
FFEL or Direct Loan Recipient – Subsidized 58%
Neither a Federal Pell Grant or FFEL, or a Federal Direct Loan Recipient 61%

*Note: Blank denotes any cohort/sub-cohort with fewer than 5 students, which is suppressed to protect the privacy of students.

Table 2: Fall 2015 Cohort

Category General Student Body Basketball Baseball Bowling Cheerleading Cross-Country Golf Soccer Tennis Track Softball Volleyball
Men
Non-Resident Alien 88% 88% 85%
Black or AA 30% 30%
American Indian/Alaskan Native
Asian
Nat Hawaiian or Other Pacific Islander
Hispanic or Latino 20%
White Non-Hispanic 65% 65% 87% 66%
Two or more races 50%
Race/Ethnicity Unknown
Total Men 62% 62% 81% 66%
Women
Non-Resident Alien 57%
Black or AA 40%
American Indian/Alaskan Native
Asian 100%
Nat Hawaiian or Other Pacific Islander
Hispanic or Latino 65%
White Non-Hispanic 59% 90% 14% 50% 55% 100%
Two or more races 50%
Race/Ethnicity Unknown
Total Women 58% 90% n/a n/a 14% n/a 50% 55% 100%

*Note: Blank denotes any cohort/sub-cohort with fewer than 5 students, which is suppressed to protect the privacy of students.

Table 3: Four Year Average Fall 2012-2015

Category General Student Body Basketball Baseball Bowling Cheerleading Cross-Country Golf Soccer Tennis Track Softball Volleyball
Men na na
Non-Resident Alien 53% 59% na na
Black or AA 41% na na
American Indian/Alaskan Native na na
Asian 60% na na
Nat Hawaiian or Other Pacific Islander na na
Hispanic or Latino 39% na na
White Non-Hispanic 63% 75% 69% 66% 71% 56% na na
Two or more races 33% na na
Race/Ethnicity Unknown na na
Total Men 60% 71% 64% 66% 67% 83% 58% na na
Women na
Non-Resident Alien 63% na
Black or AA 41% na
American Indian/Alaskan Native 80% na
Asian 54% na
Nat Hawaiian or Other Pacific Islander na
Hispanic or Latino 57% na
White Non-Hispanic 62% 82% na 43% 14% 83% 57% 43% 70% 92% 84%
Two or more races 33% na
Race/Ethnicity Unknown na
Total Women 60% 83% na 40% 83% 62% 58% 70% 92% 86%

*Note: Blank denotes any cohort/sub-cohort with fewer than 5 students, which is suppressed to protect the privacy of students.

Want to Learn More About CU?

Connect With CU